Endpoint Monitoring is the practice of probing applications/services to gather data about their availability and performance.
In many organizations, it is critical to detect application downtime early and quickly identify possible root causes for such downtime.
For this article, we will be discussing how we can design a service for endpoint monitoring in the long term.
Blackbox Exporter is a Prometheus exporter that can probe endpoints over HTTP, HTTPS, DNS, TCP, ICMP and gRPC. From the probe results, it collects metrics to provide insights on the uptime, response times, and health of the endpoints.
A simple example
Let's run through a simple setup for a small set of endpoints.
From the Prometheus and Blackbox Exporter docs, it takes 3 steps to accomplish this.
-
Run Blackbox Exporter with custom module definitions to instrument different probing behaviors.
According to the docs, the following probing functions are supported: HTTP, HTTPS (via the http prober), DNS, TCP socket, ICMP and gRPC. For simplicity, let's assume that all apps are expected to return a HTTP 2XX response and they are all running on HTTP. We can define a single module: http_2xx in our configuration:
modules:
  http_2xx:
    prober: http
    timeout: 5s
    http:
      valid_http_versions: ["HTTP/1.1", "HTTP/2.0"]
      valid_status_codes: [] # checks for any 2xx status
      method: GET
      tls_config:
        insecure_skip_verify: false # Skip verification for simplicity
  ...
  # Define more modules here if required
To validate the probing mechanism, we can initate a probe by specifying this url in the browser:
http://localhost:9115/probe?target=<endpoint>&module=http_2xxThis instructs blackbox exporter to probe
<endpoint>usinghttp_2xxmodule. -
Define a Prometheus job definition to fetch metrics from Blackbox Exporter.
scrape_configs:
- job_name: "blackbox-exporter"
  metrics_path: /probe # Metrics are collected here.
  params:
    module: [http_2xx]  # Defined in blackbox exporter configuration
  static_configs:
  # To onboard more endpoints, simply update this section
  - targets:
    - http://example.com
    - http://localhost:8000

  relabel_configs:
  - source_labels: [__address__]
    target_label: __param_target
  - source_labels: [__param_target]
    target_label: instance
  - target_label: __address__
    replacement: localhost:9115 # Blackbox exporter endpoint
We define a single job:
blackbox-exporterwhich contain the metrics_path:/probeand a static list of targets. Additionally, we take advantage of relabel_configs to define the endpoint metadata to be used in the exporter's query parameters.-
For each endpoint, we extract the
__address__and store it as__param_target, which represents thetargetquery parameter.__param_targetis then copied into a Prometheus label calledinstance. This label will helpful for filtering the Prometheus metrics later. -
We then replace
__address__with the blackbox exporter url.For example, for the static target:
http://example.com, Prometheus will call:http://localhost:9115/probe?target=http://example.com&module=http_2xx
-
-
Query your metrics via the Prometheus UI. Since we previously copied
__param_targetand created aninstancelabel, we can use that label to filter the endpoint'sprobe_successmetric using the following Prometheus query. The query returns 1 for successful probe, 0 otherwise.
probe_success{instance='http://example.com'}Simple Architecture
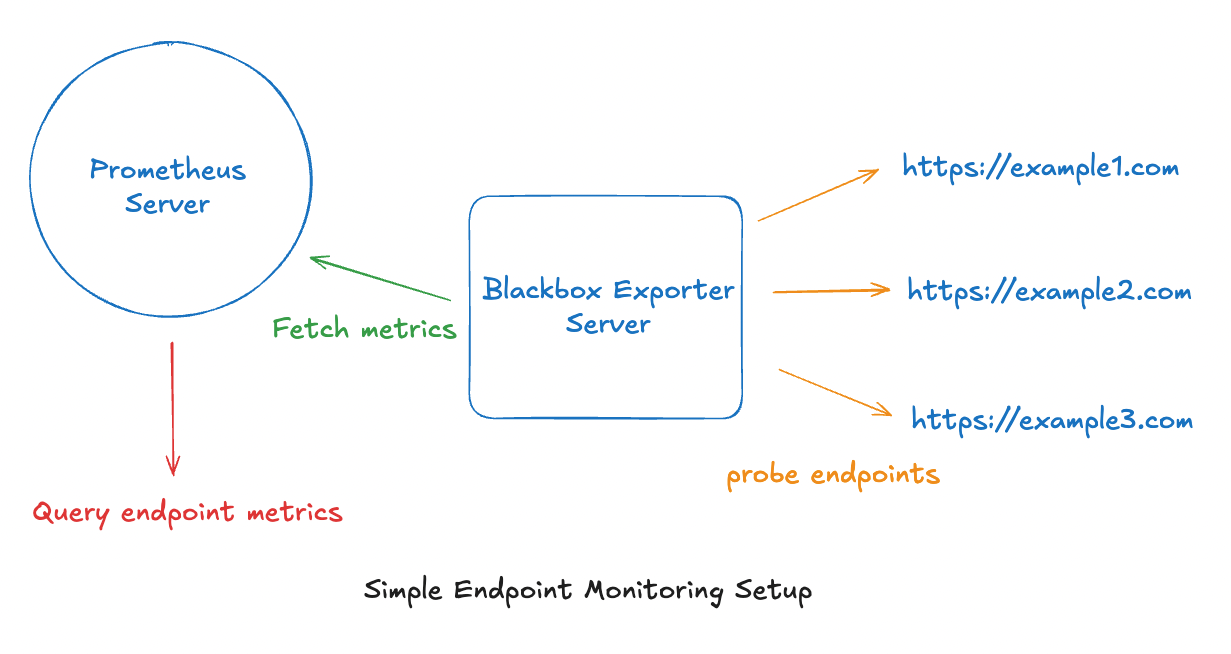
This seems straightforward. However, if you are building for the long term, you might start to notice several problems:
-
As development teams and microservices grow, the number of endpoints will increase exponentially. How do we scale up? Furthermore, this design uses 1 server per component. How do we make it highly available?
-
For a large organisation, many job definitions will have to be maintained to probe different sets of endpoints. In the long run, this activity will become an administrative nightmare - unsustainable and prone to error. Is there an easier and more foolproof onboarding process?
-
There is only a single job label:
blackbox-exporterso far. As mentioned in the previous point, there are many endpoints to be monitored in a large organisation. Can we introduce more metadata like custom labels to filter metrics for different sets of endpoints?
Requirements
In light of the above painpoints, we arrive at the following set of requirements:
-
The system must be scalable and highly available.
-
The system must be easy to maintain, with minimal operational overhead.
-
The system must allow teams to configure custom Prometheus labels for metrics filtering.
Design Improvements
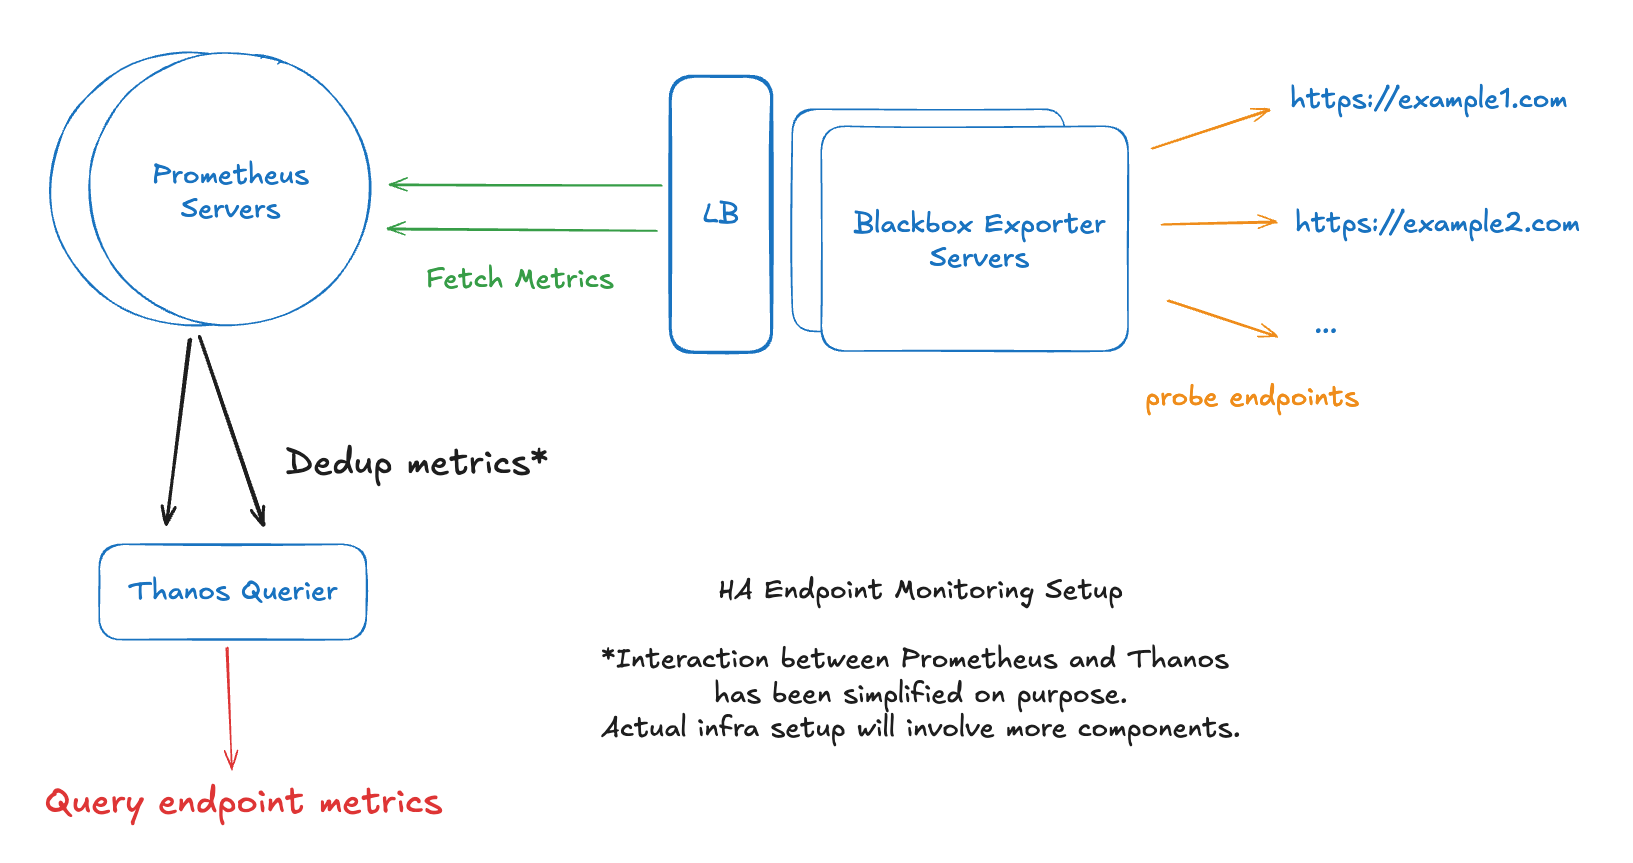
1. Scaling up + High Availability (HA)
Let's explore horizontal scaling.
-
We can increase the number of Blackbox exporter servers and set up a load balancer.
-
The main weaknesses of Prometheus are that it is designed to run on a single server and it does not implement deduplication logic. This means that
-
It's not scalable as the metric storage is limited by its local disk.
-
If we want to establish HA, we have to somehow federate and deduplicate metrics from two or more servers.
To combat these painpoints, let's perform the following.
-
Increase the number of Prometheus servers, using the same job definition. This means storing the same set of metrics across all servers.
-
To federate and dedup the metrics, we can introduce Thanos.
-
2. HTTP Service Discovery
Instead of defining a list of static targets, let's implement a service discovery mechanism using Prometheus HTTP Service Discovery. This allows Prometheus to fetch the list of targets dynamically via a HTTP endpoint.
# Updated job definition using http_sd_configs
scrape_configs:
- job_name: "blackbox-exporter"
  metrics_path: /probe
  params:
    module: [http_2xx] # Defined in blackbox exporter configuration
  http_sd_configs: # Implement service discovery
    - url: http://localhost:8000/targets # HTTP SD Endpoint
      refresh_interval: 5m

  relabel_configs:
  - source_labels: [__address__]
    target_label: __param_target
  - source_labels: [__param_target]
    target_label: instance
  - target_label: __address__
    replacement: localhost:9115 # Blackbox exporter endpoint
How do we store and expose the endpoints? We can run a backend endpoint that regularly caches and exposes this data via an API, following this response format. For this example, I have defined a backend endpoint /targets running on http://localhost:8000.
// Data format for HTTP SD API
[
    {
        "targets": [ "http://example.com" ],
        "labels": []
    },
    {
        "targets": [ "http://localhost:8000" ],
        "labels": []
    },
    ...
]
3. Simplifying Onboarding
So far, we have made significant improvement by making the targets list dynamic via service discovery, but we still can do better.
Instead of managing these endpoints ourselves, can we shift this responsibility to users?
Yes! We can build a UI to make this process self-service.
-
Users submit endpoints through a form, saved in a database. The backend caches this data and exposes it in an API endpoint, refreshed every 5 minutes.
-
Prometheus servers discovers these endpoints by calling the HTTP endpoint and relay them to Blackbox exporters to probe these endpoints.
4. Introducing Custom Labels
Previously, we learnt about using relabelling rules in relabel_configs to define query parameters and create new Prometheus labels. To inject more metadata in our metrics, we can apply the same procedure.
-
We can define the new labels in key value pairs, and store them as a hash map in the
labelsvariable.[ { "targets": [ "http://example.com" ], "labels": { "module": "http_2xx", "application": "App 1", "team": "Alpha", "environment": "prod", "datacenter": "A" } }, { "targets": [ "http://localhost:8000" ], "labels": { "module": "http_2xx", "application": "App 2", "team": "Beta", "environment": "nonprod", "datacenter": "B" } }, ... ] -
Since we are making the
moduleconfigurable, we will have to introduce a relabelling rule to pass this value as a query parameter. We no longer need theparamsblock to define a staticmoduleoption.scrape_configs: - job_name: "blackbox-exporter" metrics_path: /probe # No need for static params http_sd_configs: # Implement service discovery - url: http://localhost:8000/targets # HTTP SD Endpoint refresh_interval: 5m relabel_configs: - source_labels: [__address__] target_label: __param_target # Define target query parameter - source_labels: [__param_target] # Create instance label from target param target_label: instance - source_labels: [module] # Define module query parameter target_label: __param_module - target_label: __address__ replacement: localhost:9115 # Blackbox exporter endpoint
With this approach, we only need to maintain a single job definition, which will likely not require frequent changes in the long term. Users are free to define any custom labels they want, all managed by the backend service discovery endpoint.
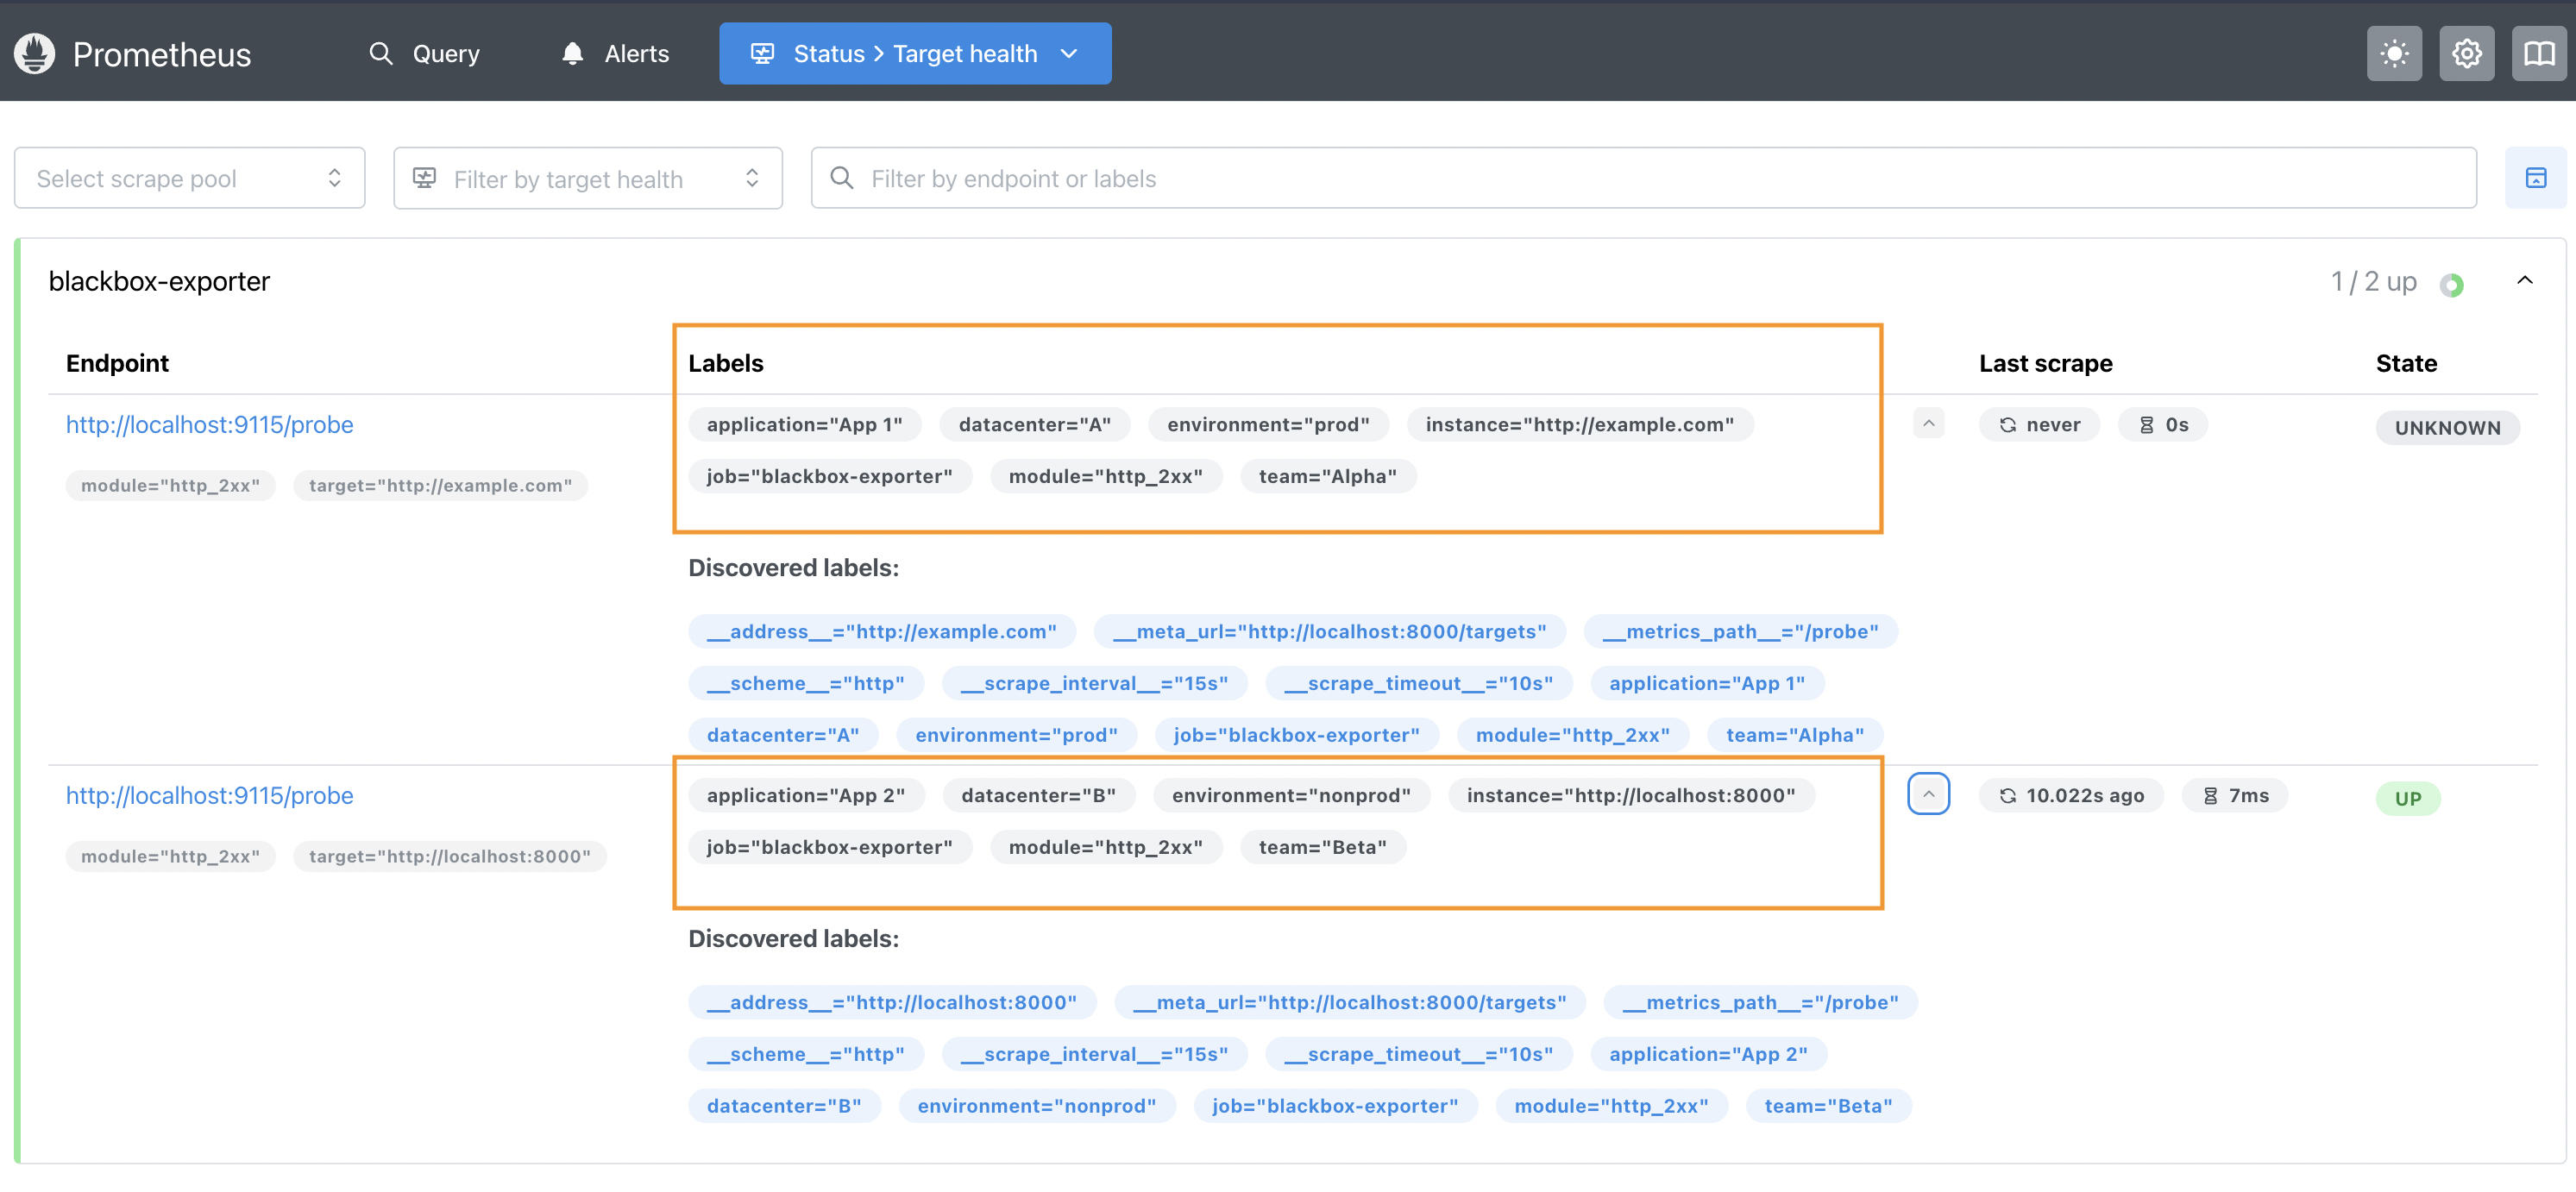
To validate if the new labels are available for filtering, we can inspect the Prometheus UI's targets health page: http://localhost:9090/targets.
Under the blackbox-exporter job, we can verify the list of different labels that were extracted from the discovered endpoints.
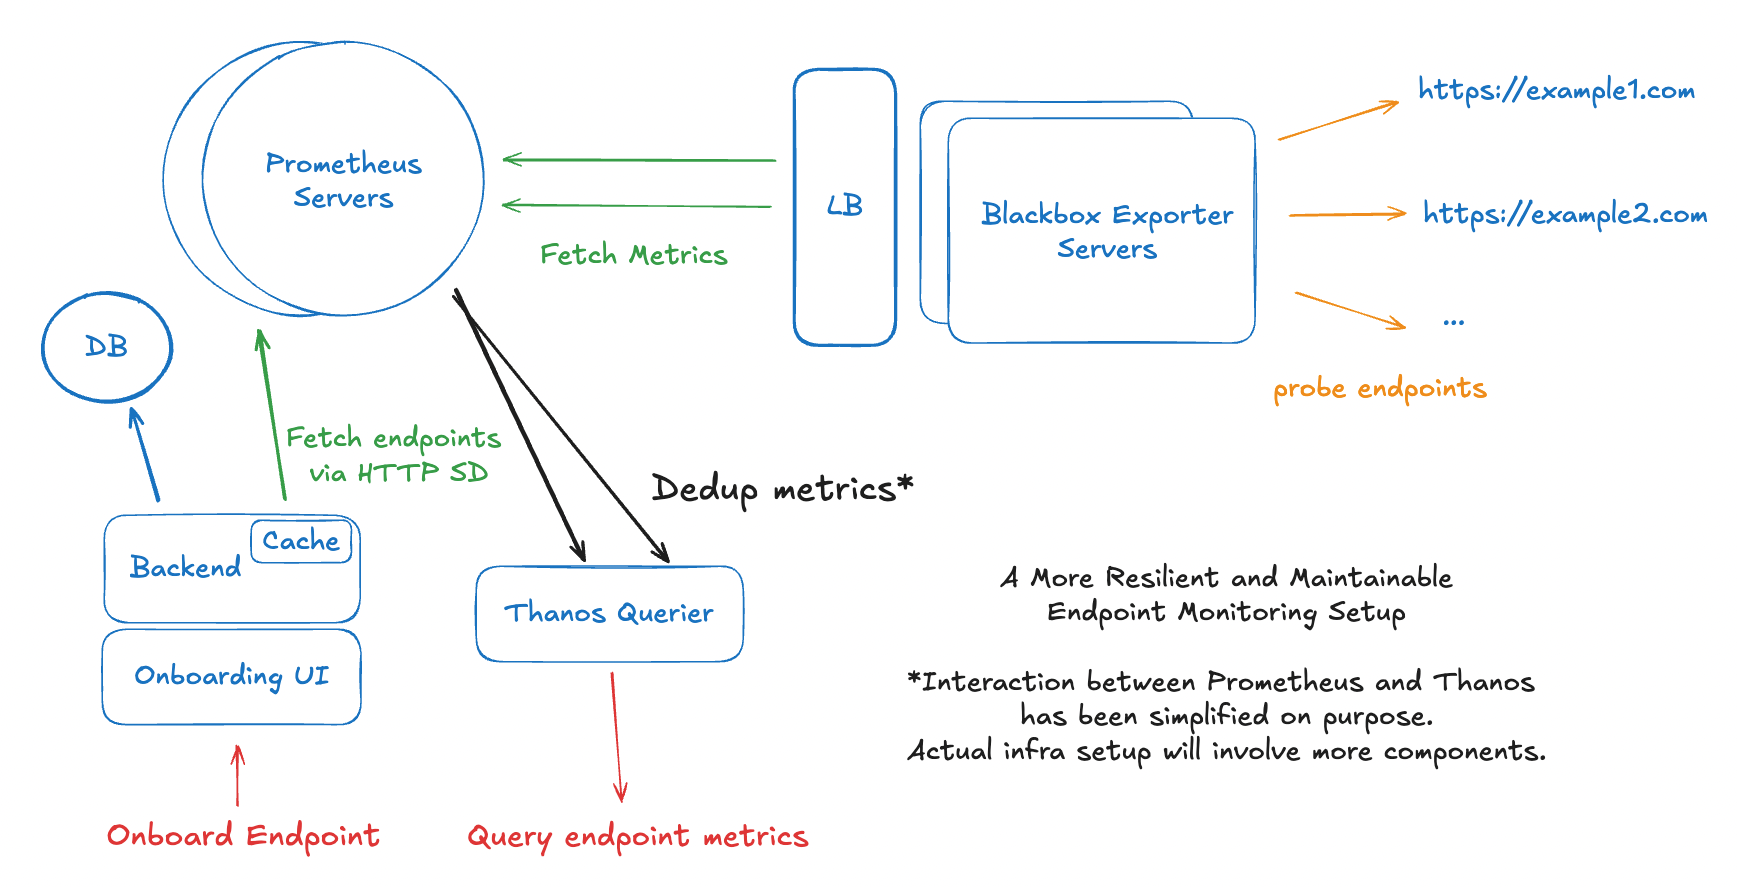
Putting Everything Together
After factoring in all the design improvements, we arrive at the following design.
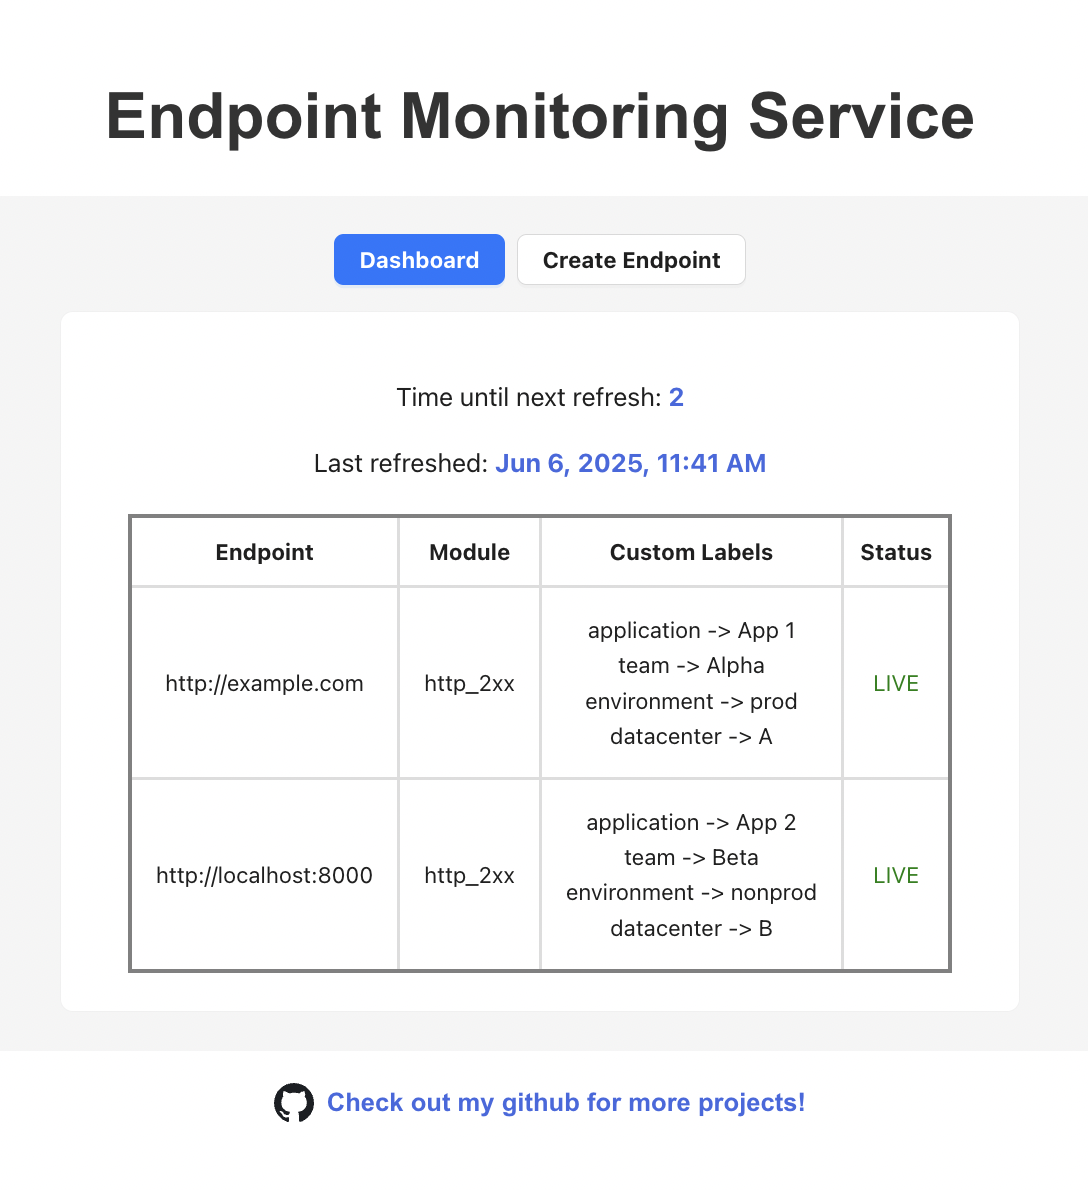
Endpoint Status Dashboard
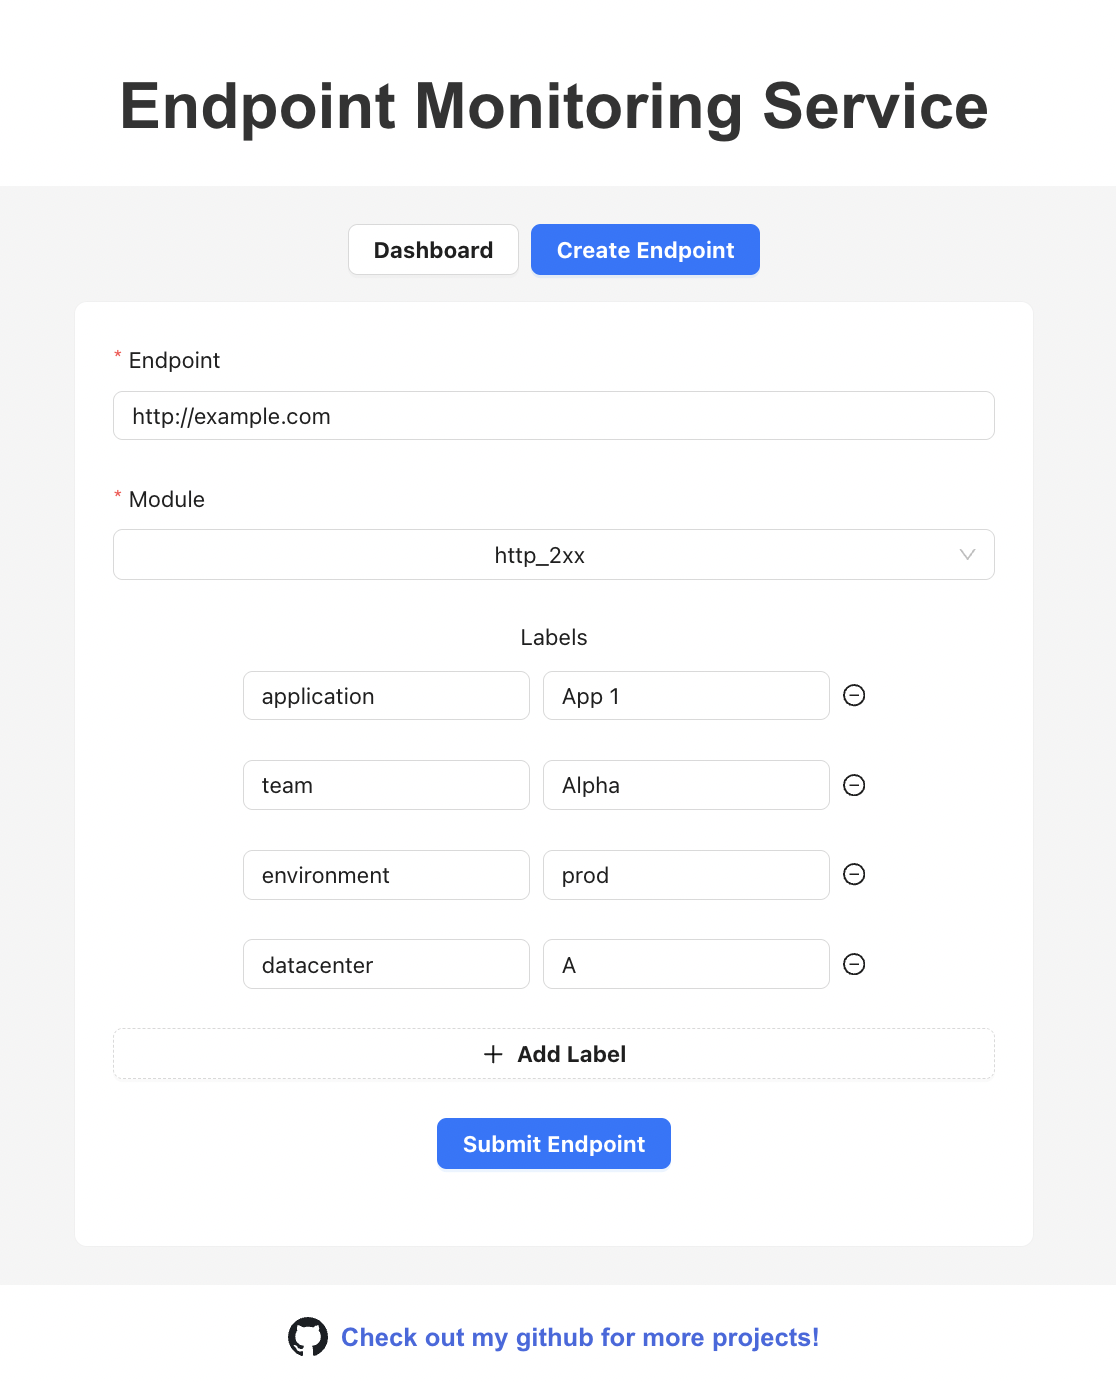
Onboarding Form
Onboarding Flow
-
Users create endpoints via a self-service form, defining additional metadata like module, team, environment, etc.
-
Backend stores and exposes the endpoint data via a
/targetsAPI, refreshed from the database in regular intervals. -
Prometheus uses HTTP Service Discovery to pull this target list, using relabelling rules to extract metadata, and passing them as query parameters to Blackbox Exporter calls.
-
Blackbox Exporter probes each target based on the module passed in the query parameter, returning metrics to Prometheus.
-
Prometheus stores these metrics, which can be queried by the UI or visualised on Grafana.
Source Code
If you are interested to learn more about the implementations covered in this blog, feel free to explore the repos below.
Endpoint Monitoring Setup - Experiments with different ways of setting up Blackbox Exporter and Prometheus for endpoint monitoring.
Endpoint Monitoring Service - Covers the end-to-end implementation of the endpoint monitoring service design we just discussed.